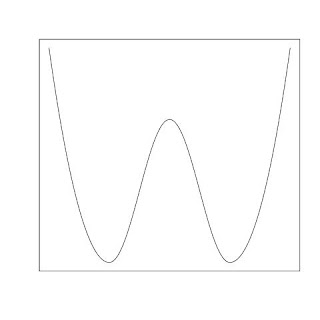
 To create a double-well image as the one in the above, we can do it in three steps
(1) The left of the first bottom can use the graph of a parabolic function.
(2) From the first bottom to the second bottom can use the graph of a cosine function.
(3) The right of the second bottom can use the graph of another parabolic function.
The following R code generates the graph above:
x2<-c(0:100)*0.02+1
y2<-cos((x2-2)*pi)
x1<-c(0:100)*0.01
y1<-3*(x1-1)^2
x3<-c(0:100)*0.01+3
y3<-3*(x3-3)^2
jpeg("doublewell.jpg")
plot(x2,y2,xlim=c(0,4),ylim=c(0,3),'l',xlab="",ylab="",xaxt="n",yaxt="n")
lines(x1,y1)
lines(x3,y3)
dev.off()
No comments:
Post a Comment